
7 Dec 2015
Simple clustering
K-means clustering is really simple, and a nice 'first port of call' when you want to investigate splitting a population into different groups based upon their characteristics- clustering techniques are key in many forms of unsupervised classification. For my example I turn to the (no suprises here) Iris data set.
The idea is pretty basic:
Decide on a metric of 'closeness' between the points
Decide how many clusters you want (call it k)
Randomly intialise k cluster centroids
Calculate how 'close' each data point is to each centroid, and assign the point to a group based upon which is the closest centroid
Recalculate the cluster (group) centroids as a 'center of mass'
Repeat steps 4 and 5 until convergence, i.e. the centroids do not change between iteration.
Approach
I decided to build this to be as general as possible, so an arbitrary number of centroids can be chosen (> 0), and an arbitrary number of dimensions can be specified (although its hard to visualise more than three!). Should you be interested, have a look at the code here.
I decided to pre-process the data by restricting to between 0 and 1. From experience with k-nearest neighbor classification algorithms, some form of normalisation is usually required, otherwise dimensions with larger absolute scales dominate those with smaller scales. Once I finish the clustering, I scale back to the origional to output the class centroids.
My metric of 'closeness' is simply the Euclidean distance between each point and the cluster centroids, generalised to multiple dimensions.
The bulk of the work is done in the kMeansP() function, which I hope is fairly self explanatory. However, as it's quite short, I'll do a quick run through of the key parts.
Firstly, we assign each point to the closest centroid using this apply loop:
inputMat[, nDim + 1] <- apply(inputMat[, 1:nDim], 1, function(x) {
  tmp <- lapply(seq(nCentroids),
                function(y) euclDist(x, centroids[[y]]))
  which.min(tmp)
})
The n+1th dimension of the matrix holds the group, and what we do is loop through rows and lapply() my custom function to determine the Euclidean distance between each centroid and the current point. We then take the minimum of this list, and assign the current group as the list index of the closest centroid.
Next, we recalculate the centroids as a 'center of mass'.
oldCentroids <- centroids
centroids <- lapply(seq(nCentroids), function(x) {
  tmp <- inputMat[inputMat[, ncol(inputMat)] == x, 1:(ncol(inputMat) - 1)]
  apply(tmp, 2, COM)
})
We subset inputMat (ignoring the final column, which holds the group index) into tmp, which holds only those points for the current centroid that we are considering. Then, we apply the COM() function for each dimension of the current centroid (iterating through columns). The outer lapply() loop considers each centroid in turn.
The final test is for convergence- do the current and previous centroids change? If they dont, we break out of the loop, and all is finished!
Results
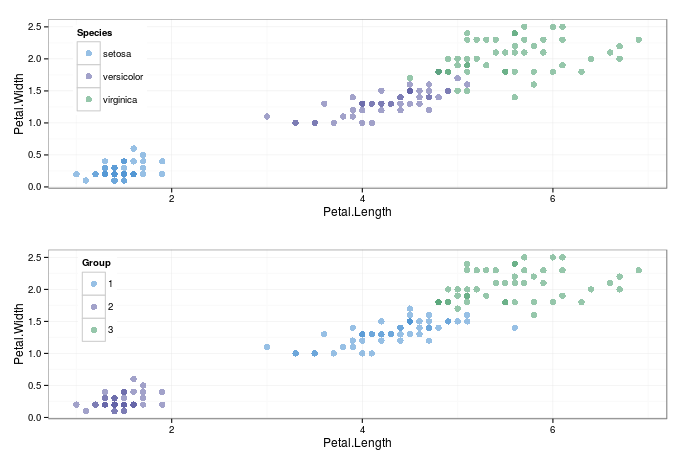
The graph below shows the origional data compared to the clustered- its not done too bad a job of seperating the iris species! Obviously, as this is an unsupervised technique, the algorithm simply seperates based upon the specified number of clusters, with no knowledge about whether the groups it specifies are sensible.
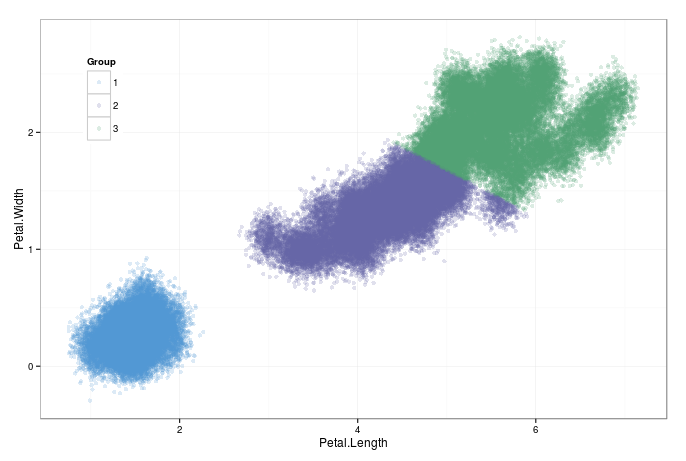
How does it perform when scaling up? I generated a hundred thousand points by sampling from the dataset with replacement, and adding some random noise. It less than 30 seconds on my laptop to converge. Thats good enough, for the time being.
As a word of warning, and a lesson to be learned from my mistakes; I initially sampled the starting cluster centroids by subsetting three random points from the data frame containing the input. This left the initial centroids with a class of data frame. The first loop has SIGNIFICANTLY more work to do (mainly the which.min() function) when working with a data frame compared to objects of class numeric. The time taken was at least an order of magnitude greater to complete the step in the algorithm. This is a massive danger when using a dynamically typed language such as R; unexpected things can happen when objects arent of the type you think they are, and it can sometimes require a lot of head scratching to diagnose the (usually simple) issue.
Other thoughts
I think one of the easiest ways to increase peformance is to consider how to tackle the looping. We have two fairly straightforward options:
Think about going parallel- this algorithm is well suited to it. Many of the looping tasks can be performed in parallel independantly of one another. A parallel implementation of the apply parts could give us some decent speedup.
Rather than looking to go parallel with R, its usually more efficient just to write code in a compiled language. With the Rcpp package, integrating high peformance C++ with R is made easy. The overhead for loops is much, much lower in C++, so a well written C++ function would probably be a vastly more efficient implementation of a clustering algorithm.
Perhaps next time I am bored on a train, I will have a crack at implementing these...
TL;DR - a simple k-means clustering algorithm, written in R. The code is here.